Instant Savings
 Rebate Claims
 Support
 Find a Dealer
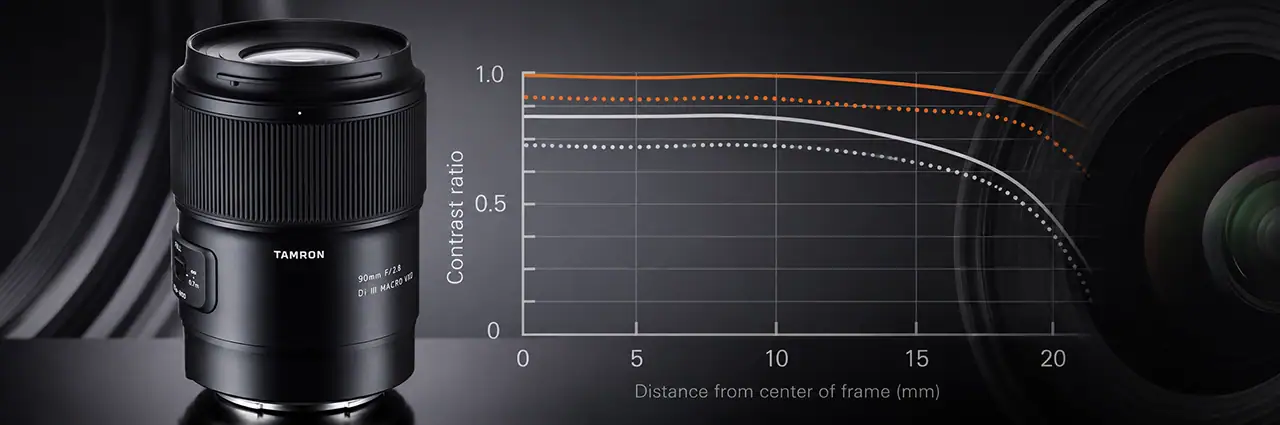
When choosing a lens, you may see an “MTF curve” in a catalog or on a website. At first glance, this graph may look complicated, but understanding its meaning will help you choose a lens. In this article, we will explain the basics of how to look at this MTF curve and how to use it when choosing a lens.
Table of Contents
- What is MTF (MTF curve)?
- What is modulation transfer function in a camera lens?
- What does an MTF chart measure?
- How to read an MTF chart
- How MTF charts show lens contrast and resolution
- How do you read an MTF chart for a zoom lens?
- What does a good MTF chart look like?
- Can an MTF chart predict lens sharpness?
- Points to note when looking at an MTF curve
- How to use an MTF curve when comparing lenses
- Frequently asked questions
What is MTF (MTF Curve)?
MTF stands for modulation transfer function. An MTF chart is a graph that shows how well a lens reproduces contrast and fine detail from the center of the image toward the edges. Lens makers publish MTF charts so photographers can compare optical performance before they buy.
When choosing a camera lens, you will see an MTF curve in most catalogs and on most product pages. The graph looks dense at first, but each element has a specific meaning, and reading it takes only a few minutes to learn. In this article, we explain what modulation transfer function means, how to read an MTF chart, and how to use MTF curves as one reference when choosing a camera lens.
What Is Modulation Transfer Function in a Camera Lens?
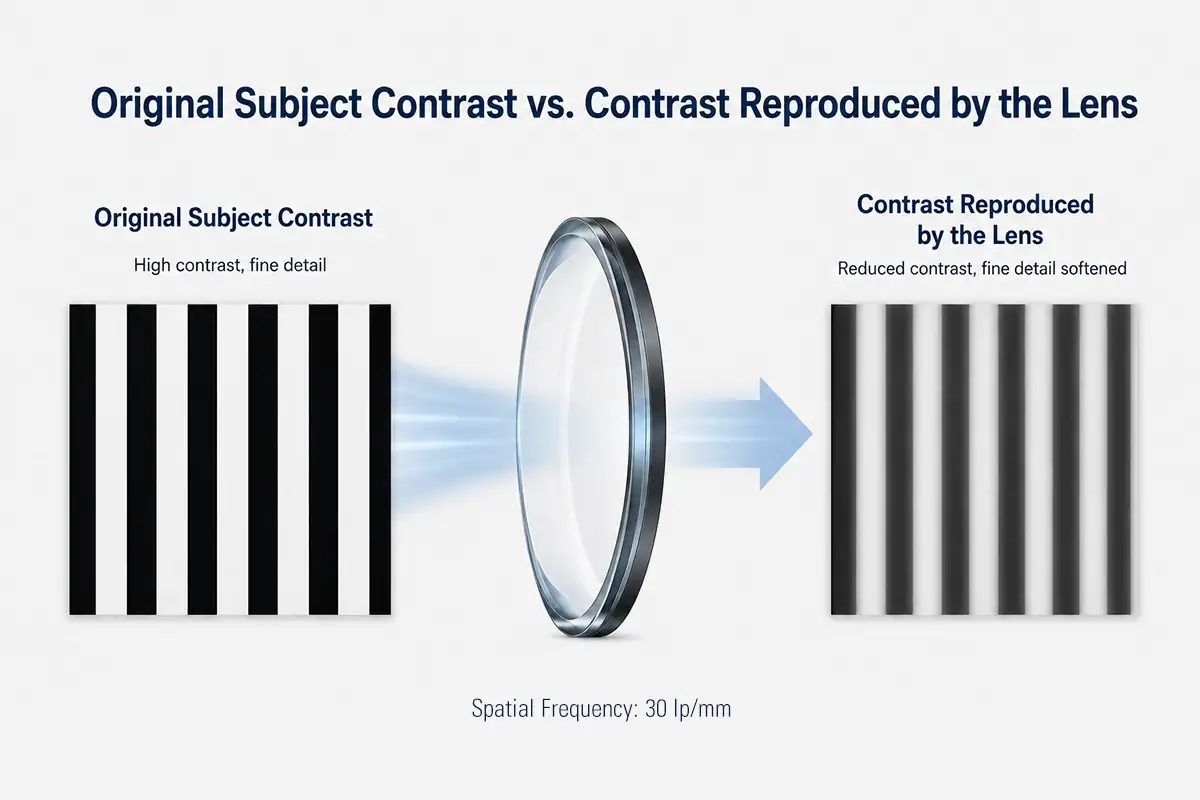
Modulation transfer function measures how faithfully a lens transfers the contrast and detail of a subject onto the camera sensor. Every lens loses some contrast. An MTF chart shows how much the lens keeps at different levels of detail and at different points across the image frame.
No lens reproduces every line, texture, and edge with exactly the contrast of the original subject. The chart makes that loss visible and measurable. Optical manufacturers compute MTF as a way to combine resolution and contrast data into a single specification, which is why the same graph answers questions about both.
The horizontal axis, or X-axis, represents image height, meaning the distance from the center of the image toward the edges. The vertical axis, or Y-axis, represents the MTF value used to evaluate lens performance.
This graph is called an MTF curve, MTF chart, or MTF diagram. It is used as important reference data for evaluating the contrast reproduction and resolution potential of a lens.
What Does an MTF Chart Measure?
An MTF chart measures two things: contrast and resolution. Contrast is how clearly the lens separates light areas from dark ones. Resolution is how well the lens renders very fine, closely spaced detail. Together these two measures describe how a lens reproduces an image across the frame.
Strong contrast gives an image a crisp appearance with well-defined edges and clear tonal separation. Strong resolution preserves fine textures such as hair, feathers, fabric, foliage, and architectural detail.
Some photographers call an MTF chart a lens sharpness chart. That label is imprecise. The chart shows how effectively a lens reproduces contrast at different levels of detail, which is related to sharpness but not identical to it.
How to Read an MTF Chart
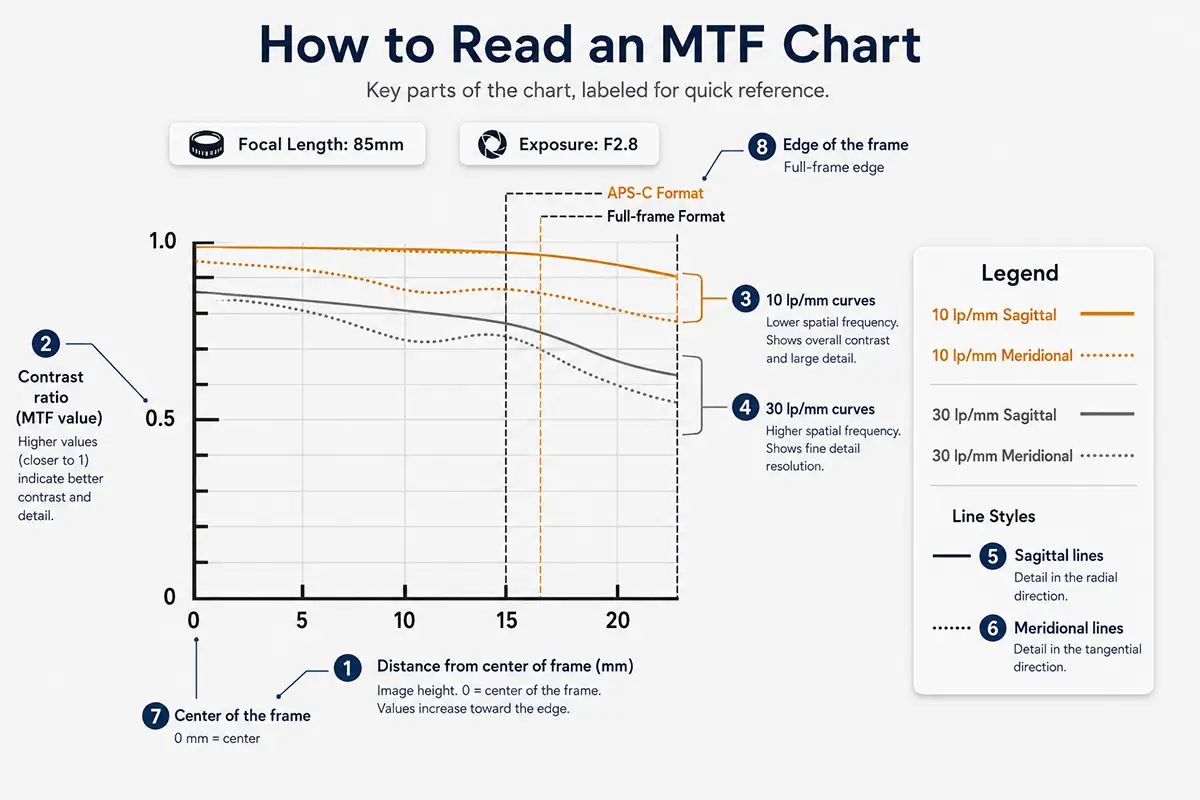
Read an MTF chart in four steps.
- Check the horizontal axis for image height, the distance from the center.
- Check the vertical axis for the MTF value.
- Identify the 10 lp/mm and 30 lp/mm curves.
- Then compare the sagittal and meridional lines to see how evenly the lens performs.
An MTF chart holds several lines at once, but each one answers a separate question. The sections below take them one at a time.
Horizontal Axis: Image Height and Distance From the Center
The horizontal axis shows the distance from the center of the image frame in millimeters. A value of zero represents the optical center of the image.
As the graph moves from left to right, it shows lens performance farther away from the center and closer to the edges and corners of the frame.
A curve that remains relatively high across the graph indicates that the lens maintains more consistent performance from the center toward the edges. A curve that falls noticeably toward the right indicates a greater reduction in contrast or fine-detail reproduction near the image periphery.
Vertical Axis: MTF Value
The vertical axis displays the MTF value, generally ranging from zero to 1.0. A curve positioned closer to 1.0 indicates that the lens is maintaining more of the original subject contrast at that spatial frequency and image position.
In general, higher curves indicate stronger contrast reproduction or resolution. However, the MTF value is not a measurement of the amount of light passing through the lens. It represents how much contrast is reproduced under the conditions used to create the chart.
What Do 10 lp/mm and 30 lp/mm Mean?
Line pairs per millimeter (lp/mm) describe how fine the test pattern is. Tamron publishes curves at 10 lp/mm and 30 lp/mm. The 10 lp/mm curves show how the lens reproduces broad contrast. The 30 lp/mm curves show how the lens resolves fine detail such as hair or fabric.
The limited resolution of the optics matters more at higher spatial frequencies, where the scale of the detail is smaller, and MTF is generally a decreasing function of spatial frequency. A lens that maintains high values at both 10 lp/mm and 30 lp/mm can be expected to provide a strong balance of contrast and fine-detail reproduction.
What Are Sagittal and Meridional Lines?
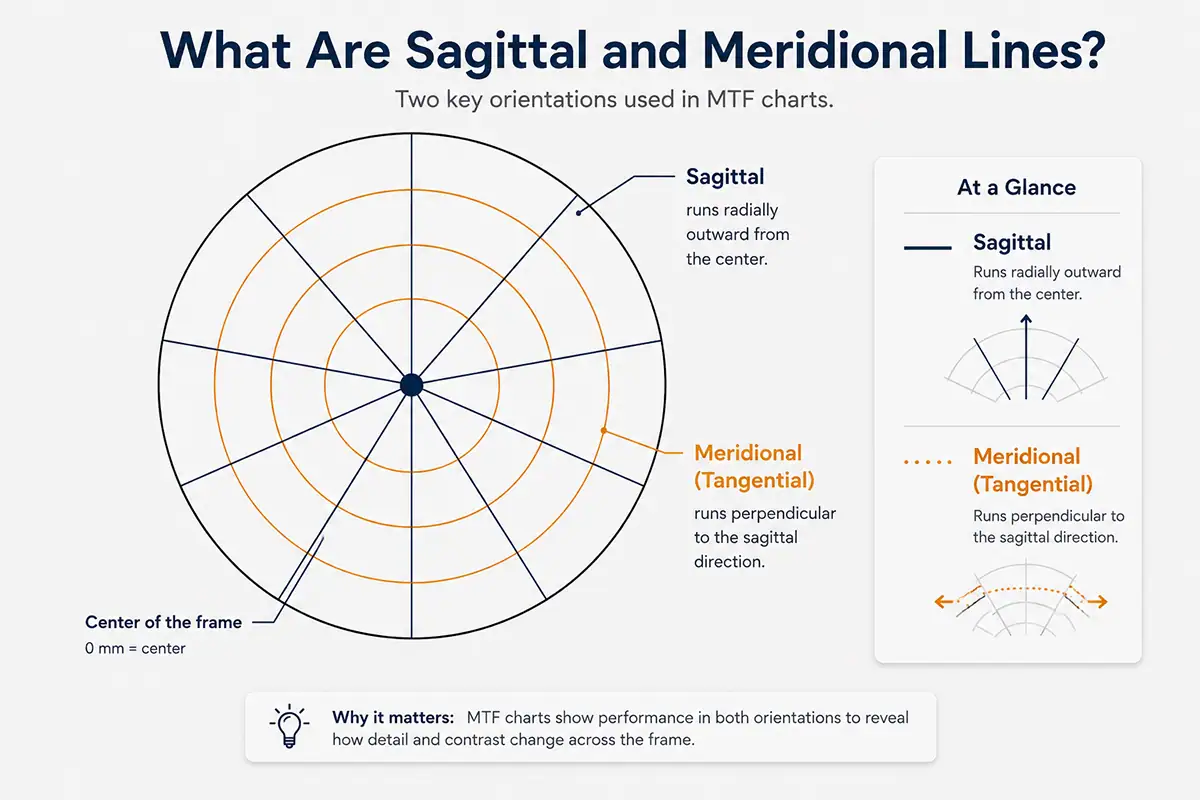
Sagittal and meridional lines describe the two directions a lens reproduces detail. Sagittal lines run radially outward from the center of the frame. Meridional lines, also called tangential lines, run perpendicular to them. When the two curves sit close together, the lens renders detail evenly in both directions.
The chart legend identifies which curve is which. When the two curves separate substantially, the lens reproduces one orientation differently from the other, often because of astigmatism.
The gap between sagittal and meridional curves offers limited insight into how a lens renders out-of-focus areas. It is not a measurement of bokeh quality. Sample images remain the better test.
What Do High and Flat MTF Curves Mean?
In general, higher and flatter MTF curves are desirable.
High curves and flat curves both signal strong optical performance. A high curve means the lens holds strong contrast or resolution at that spatial frequency. A flat curve means performance stays consistent from the center to the edges. A curve that drops sharply to the right shows weaker edge performance. A curve that begins high and gradually falls toward the right suggests that contrast or fine-detail reproduction decreases toward the edges of the frame. This is common to some degree in many lenses, particularly when they are used at their maximum aperture.
How MTF Charts Show Lens Contrast and Resolution
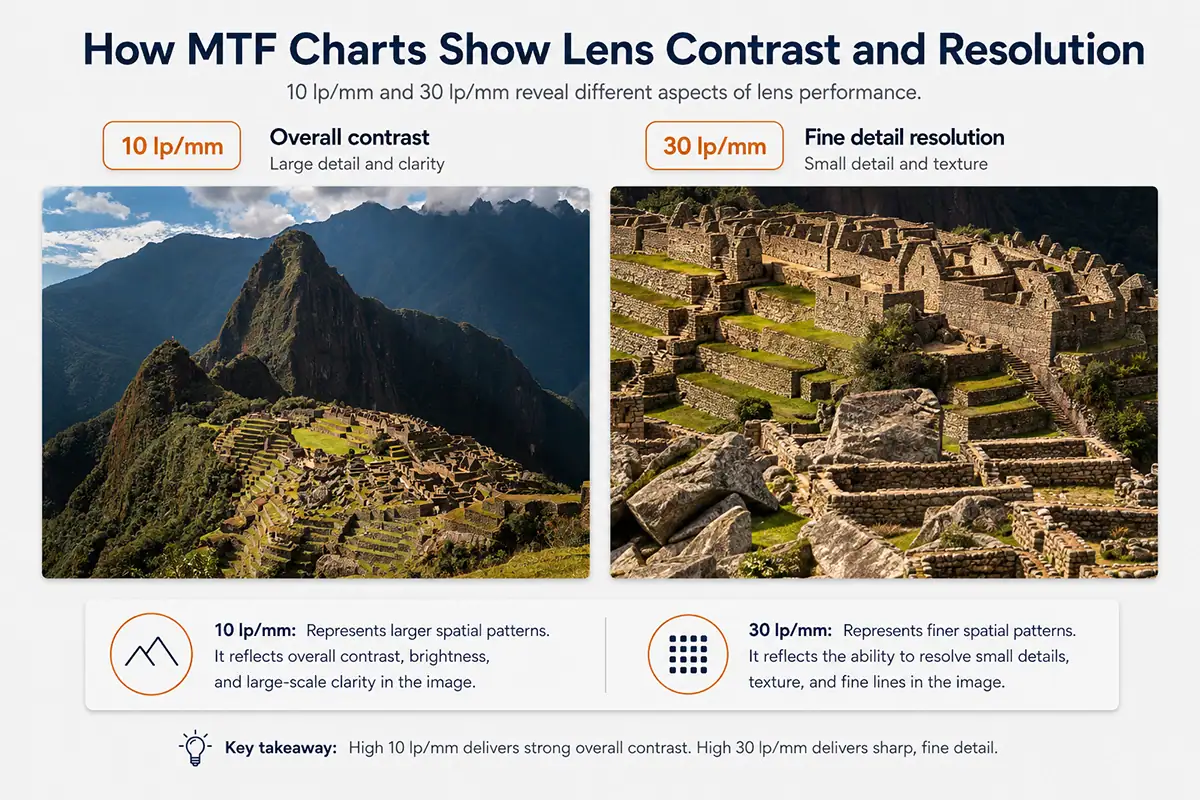
The 10 lp/mm and 30 lp/mm curves provide different but complementary information about lens performance.
The 10 lp/mm curves provide insight into how clearly a lens reproduces larger patterns and overall contrast. Strong performance at this frequency can contribute to images that appear clear, dimensional, and visually crisp.
The 30 lp/mm curves provide insight into how well the lens resolves smaller details. Strong performance at this frequency is especially important when photographing subjects with fine textures or when images will be enlarged or cropped.
A lens may show strong contrast performance but somewhat lower fine-detail resolution, or it may resolve small details well while showing less consistency toward the edges. For this reason, the full set of MTF curves should be considered rather than focusing on only one line.
How Do You Read an MTF Chart for a Zoom Lens?
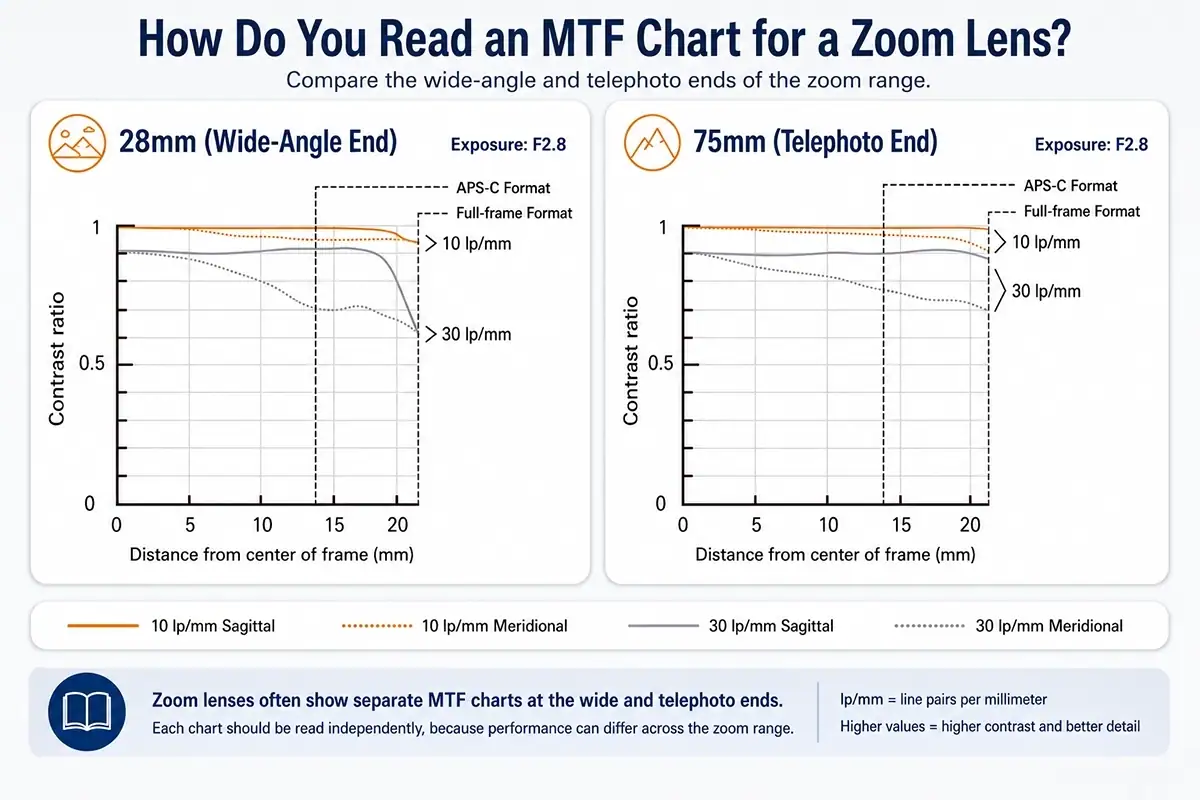
Zoom-lens product pages commonly display separate MTF charts for the wide-angle and telephoto ends of the focal range. For example, a 28-75mm zoom lens may include one chart at 28mm and another at 75mm.
Read each chart independently, paying attention to the focal length and aperture identified above it. A zoom lens may perform differently at the wide-angle end, middle of the range, and telephoto end, so one graph should not be assumed to represent every focal length.
MTF charts are also commonly presented at or near the maximum aperture of the lens. Always check the labels and conditions shown with the individual chart before making a comparison.
What Does a Good MTF Chart Look Like?
A strong MTF chart generally has 10 lp/mm and 30 lp/mm curves that remain high from the center toward the edges.
High 10 lp/mm curves indicate strong overall contrast reproduction, while high 30 lp/mm curves indicate strong fine-detail resolution. Relatively flat curves suggest more consistent performance across the image frame.
Sagittal and meridional curves that remain reasonably close together indicate more similar reproduction of line detail in both orientations.
However, there is no single MTF curve shape that automatically makes one lens the best choice. Lens designers must balance resolution, contrast, size, weight, aperture, focal range, autofocus performance, close-focusing capability, bokeh, distortion correction, and other optical characteristics.
Can an MTF Chart Predict Lens Sharpness?
An MTF chart can provide useful information about a lens’s contrast and resolution potential, but it cannot predict every aspect of perceived sharpness in an actual photograph.
Final image sharpness is also affected by focusing accuracy, camera movement, shutter speed, aperture, subject movement, sensor resolution, image processing, filters, atmospheric conditions, and viewing size.
Higher 30 lp/mm curves generally indicate stronger fine-detail resolution, while higher 10 lp/mm curves can contribute to greater perceived clarity. However, the MTF chart should be treated as a reference rather than a guarantee of the sharpness achieved in every shooting situation.
Points to Note When Looking at an MTF Curve
An MTF curve has three important limits. It measures only part of a lens’s performance. It does not support comparisons across manufacturers. And it reflects one aperture and focusing distance, not every shooting condition. Keep these limits in mind when you use MTF data to choose a lens.
The three sections below cover each limit in turn.
MTF Is Only a Reference Indicator
The performance of a lens cannot be fully explained by the MTF curve alone.
Characteristics that are important in actual photography, such as the appearance of bokeh in portraits, richness of gradation in landscape photography, flare resistance, color fringing in backlighting, autofocus performance, and close-focusing capability, cannot be completely evaluated from an MTF chart.
In addition, Tamron’s published MTF values are calculated as theoretical values and may differ from performance under actual shooting conditions.
Manufacturing tolerances, focusing distance, aperture, camera sensor, subject movement, camera shake, filters, image processing, and other factors may influence the final photograph.
It is therefore best to consider the MTF curve as one reference indicator and also examine sample photographs, specifications, reviews, and real-world usability.
Do Not Directly Compare MTF Charts From Different Manufacturers
MTF charts are most useful when comparing similar lenses from the same manufacturer.
Different manufacturers may calculate, measure, label, or display MTF data under different conditions. Some charts may be based on theoretical optical calculations, while others may use measured performance. The frequencies, apertures, wavelengths, and testing methods may also differ.
For that reason, a curve that appears slightly higher on one manufacturer’s chart does not necessarily prove that its lens will outperform a lens shown on another company’s chart.
ISO 12233 specifies methods for measuring the resolution and the spatial frequency response of digital cameras, and independent testing organizations use it to produce comparable results. Manufacturer-published MTF charts are not required to follow it.
Cross-brand comparisons should also consider sample images, consistent independent testing, specifications, and real-world use.
MTF Does Not Represent Every Aperture or Focusing Distance
An MTF chart reflects performance under the conditions stated for that particular graph. It does not necessarily show how the lens performs at every aperture, focal length, focusing distance, or wavelength of light.
A lens may improve when stopped down from its maximum aperture, although using a very small aperture can eventually reduce fine-detail resolution because of diffraction.
The chart should therefore be treated as a useful representation of specific optical conditions rather than a complete description of every way the lens may perform.
How to Use an MTF Curve When Comparing Lenses
Compare MTF curves only between lenses with similar focal lengths and apertures from the same manufacturer. Check the focal length and aperture on each chart first. Then read the 10 lp/mm curves for contrast and the 30 lp/mm curves for fine detail and note how far each curve drops toward the edges.
Work through the charts in this order:
- Confirm the focal length and aperture labeled on each chart match.
- Compare the 10 lp/mm curves for contrast reproduction.
- Compare the 30 lp/mm curves for fine-detail resolution.
- Note how high each curve starts at the center and how far it falls toward the edge.
- Check how closely the sagittal and meridional curves track one another.
Then decide which part of the frame matters for your work. A portrait photographer values strong central performance and pleasing rendering. A landscape, architecture, or astrophotography photographer needs consistent sharpness into the corners.
The curve is never the whole answer. Weigh it alongside sample images, handling, autofocus performance, size, weight, focal range, close-focusing ability, and the look you want your photographs to have.
Use Modulation Transfer Function as One Part of Lens Selection
An MTF chart provides a useful way to understand how a lens is designed to reproduce contrast and fine detail from the center of the image toward the edges.
By learning how to recognize the 10 lp/mm and 30 lp/mm curves, sagittal and meridional lines, image height, and changes in performance across the frame, you can make more informed comparisons between similar lenses.
Modulation transfer function is not a complete lens rating, however. The best lens is the one that combines the optical performance, focal range, aperture, autofocus, portability, rendering, and handling needed for the photographs you want to create.
Where to Buy Tamron Lenses
Tamron publishes MTF charts for every lens. Learn more about Tamron lenses at an authorized Tamron dealer near you or shop directly at the official TAMRON Store.
Frequently Asked Questions About Modulation Transfer Function and MTF Charts
What Does MTF Stand For?
MTF stands for Modulation Transfer Function. It describes how effectively an optical system, such as a camera lens, reproduces contrast at different levels of detail.
Does a Higher MTF Value Mean a Lens Is Sharper?
A higher MTF curve generally indicates that the lens maintains more contrast at the tested spatial frequency.
Higher 30 lp/mm curves are particularly relevant to fine-detail resolution, but perceived sharpness also depends on contrast, focusing accuracy, camera movement, sensor resolution, aperture, processing, and viewing conditions.
Is an MTF Chart the Same as a Lens Sharpness Chart?
An MTF chart is sometimes informally called a lens sharpness chart, but this description is incomplete.
The chart evaluates contrast reproduction at different spatial frequencies and image positions. This provides useful information about both perceived clarity and fine-detail resolution, but it does not measure every factor that contributes to image sharpness.
Can an MTF Chart Predict Bokeh?
An MTF chart cannot provide a complete or reliable evaluation of bokeh.
The relationship between sagittal and meridional curves may offer limited information about how similarly the lens reproduces detail in different directions, but bokeh is also influenced by optical design, aberration correction, aperture shape, focusing distance, subject distance, and background structure.
Sample photographs are a better way to evaluate whether a lens produces the type of background blur you prefer.
Can You Compare MTF Charts From Different Lens Brands?
Direct comparisons between manufacturers should be approached carefully because the charts may be generated using different calculations, measurements, frequencies, apertures, and testing conditions.
MTF charts are most useful when comparing similar lenses from the same manufacturer.
Are MTF Charts Measured at Maximum Aperture?
Many manufacturer MTF charts represent a lens at its maximum aperture, but this should not be assumed in every case.
Check the focal length, aperture, and testing conditions printed above or beside the graph. Zoom lenses may include separate charts for their wide-angle and telephoto positions.
Do MTF Charts Show Corner Sharpness?
Yes. The horizontal axis moves from the center of the image toward the edge, so the right side of the chart shows expected peripheral and corner performance. The exact edge position depends on the sensor format and the image height labeled on that chart.
About the Author
 Stacie Errera is Vice President of Marketing and Communications for Tamron Americas, where she has been with Tamron for more than 36 years. She is also a photography educator who teaches new camera users how to better understand their cameras and photography basics. She leads weekend photography workshops for women. Read Stacie’s full bio >>